Responsible Spending:
It should not come as a great surprise
to anyone that we will be turning our attention to the economic
situation in a week when the budget was released and the opposition
budget reply naturally followed. This was also a week that saw France
officially describe its financial situation using the R-Word and
Gina Rinehart once again bemoaned the state of Australia’s
finances, despite having enough money to personally bail out a small
nation (or at least share with her children). Tony Abbott described a
Budget Emergency this week. We recently dropped below parity with the
$USD. Bill Gates is once more the richest person in the world. It
seems fitting to summarise the entire economic world with a phrase
from the master of the dramatic arts: “it is a tale told by an
idiot, full of sound and fury,
signifying nothing.”
I have written previously that I shall restrict myself to analysis and interpretation, not opinion. This is a little inaccurate if you take into account my admittedly subjective tirade against the current incarnation of our compulsory voting system. However I do strive to be nonpartisan and to rely on evidence wherever possible – within the loose shackles of a light, entertaining and occasionally jocular blog format. For this reason I will not be critiquing the contents of the budget or the Coalition’s reply. And, of course, factoring in the effect of the budget on the predicted voting patterns of the public can never be more than pure speculation, even with accurate and targeted polling data. I will, however, be looking at what the budgets can tell us about the strategy of both major parties for the upcoming election and how this may influence our election predictions.
This week we saw an austere and “responsible” plan from both [sic] sides. Responsible spending is one of those great political terms that seem to cluster around economics and finance, like “eliminating waste”. It is a great term because it is both simple and evocative. It is a great term because it is something every household can relate to. It is a great term because it automatically implies that your opponents are economically incompetent, and because it questions both the funding and necessity of their policies in general without calling on specifics. And it is a great term because it is something every Australian voter can agree to oppose in principle; who could possibly support irresponsible spending?
But most of all, from a political point of view at least, it is a great term because it can mean absolutely anything and therefore binds you to absolutely nothing. Normally it implies reduced spending – especially in the current economic climate – but this is not necessarily the only interpretation. Responsible spending can range from winding back funding to ‘unnecessary’ projects to throwing truckloads of cash at policies where it is ‘cheaper to fix the problem now than deal with it later’. It can mean not wastefully over funding schemes that could succeed on much smaller budgets, or it can mean providing enough resources to ensure targets are reached and previous investments were not wasted. One could argue that additional funding for childcare would be irresponsible if the budget were particularly strained. Conversely one could argue that any investment to allow many parents – particularly single parents – to get back to work, earn a decent salary and pay more income tax is necessary to boost government coffers.
Effectively, responsible spending means funding the initiatives a party considers important, and cutting funding to those it opposes or simply considers ineffective. It means funding the policies they support, and not those that they oppose. It is stating the blatantly obvious, while making the other side look bad – and you don’t even have to make any new commitments.
Responsible spending is always a defensive position, a reaction to both the economic circumstances at home and abroad as well as the policies of others. After the aggressive and disenchanting election of 2010 where Labor and the Coalition both went on the offensive, it is interesting to see both [sic] sides of politics playing such a defensive game this year.
Both the ALP and the Coalition have proposed very similar plans with an emphasis on reducing spending – responsibly, of course – and delivering a budget surplus. The Coalition has to prove they can deliver a surplus because that is what the Liberal Party has been promising for quite some time now. The Labor Party needs to prove they can deliver a surplus because that is what the Liberal Party has been promising for quite some time now. However there is an argument to be made that a healthy economy is a means to an end, and not an end in itself. Having some money left over is useful in the event of a crisis. On the other hand, it is a bit redundant if, in order to obtain that surplus, the government needs to expose the nation to a crisis by cutting funding to education, health, defence and other vital services.
Normally a budget based on reducing spending is far more about perception and politics than about actual governance. Given the economic situation globally there is a genuine need to keep Australia in a position where we can avoid Eurozone-style recessions, so there is probably a mix of government and politics in this year’s budget. However, we are not experiencing the budget emergency Abbott suggests. Here is a graph representing debt among 19 of the G20 economies (the 20th economy is the European Union which is difficult to calculate and already includes several economies represented here).

Source for debt figures.
Now you can say that any debt is bad debt, but notice that all 19 of the most important economies in the world are in debt right now, because even bad debt is better than not being able to fund basic services. Australia’s 420-odd billion in debt does need to be paid back eventually, but it is insignificant compared to Japan or the USA, for example. Unemployment is at record lows and we have a triple A credit rating, both of which suggest we are in a good position to pay this debt back over the next decade or so. A more important factor is nominal GDP – the amount of money the country makes. This relates (through government revenue by taxation) to our ability to pay the money back. If debt is equal to nominal GDP then we are making as much each year as our debt. In other words if we put all of our profits towards paying off the debt it would take one year. Of course, we won’t put all of our profits towards that because most of that money stays in our pockets, and that which does go to the government also needs to be spent on important services that keep the country running. Nonetheless, a higher GDP puts us in better stead to pay back the debt.
In the next graph debt is still represented by the countries flags, which are now hoisted on flagpoles representing nominal GDP. The GDP can be measured against the scale on the Y axis, and the debt is to scale. The bottom of each banner, as a result, indicates on the Y axis’s scale the change each nation would get if it tried to pay off its debt with one years GDP. It’s the flag-to-flagpole ratio that illustrates how big the debt problem is. A small flag on a high mast is great news. A long banner on a short flagpole – I’m looking at you, Japan – is not so good. Compare our situation to, for example, Germany (the super-economy propping up most of Europe) or China (our local economic superpower) and decide for yourself how big Abbott’s budget emergency really is:

The Labor Budget:
During the WA election some of my predictions were thrown out by local spending, referred to by Coalition politicians as “sandbagging”. One of the lessons I took from that election was the importance of considering local issues – especially financial issues – in close-run seats. The following week I looked at the spending allocated to Western Sydney and we saw that Labor was not so much interested in winning seats here as they were in not losing them. I would like to do a similar, nationwide analysis of the budget spending.One of my Archaeological colleagues recently suggested there are two types of voters – those who vote based on ideology and those who vote based on personal gain. I am not convinced that these are the only kinds of voters (e.g. there are people who vote based on perception and personalities). I am also not convinced that everyone falls neatly in one of these categories exclusively. Importantly, which type of voter someone is may depend on various demographic factors, so the budget spending’s effects might be downplayed or amplified in different seats depending on the average age, profession, education level etc. of the constituents. However, let us assume that all voters vote based purely on their own personal benefit from the budget. The question I then want to ask is ‘just who is Labor winning over, and who are they losing?’
Now obviously a 10 million dollar announcement will have less impact than a 10 billion dollar one, and all announcements will effect everybody to some extent (even if only through the non-funding of projects they would more directly benefit from). To simplify things, I am going to look at what I consider to be the top five announcements (as determined by the amount of media coverage, how much the ALP probably intends to trumpet the project and how much it costs) and then determine who are the people most likely to benefit or lose out as a result, and where they are most likely to live.*
Announcement 1: National Disability Insurance Scheme
The NDIS is a much celebrated scheme to ensure equal access to quality services for disabled people and an attempt to prevent as many cases ‘falling through the gaps’. The obvious group to be most affected by this are people living with disabilities.

Announcement 2: Raising the Super
Guarantee
With an ageing population, many are concerned for their retirement. Younger voters will see many more changes to superannuation before they retire, and probably have more immediate concerns. This policy is complex, with gains and losses. There is less government contribution to superfunds and less tax concessions for the rich but a higher tax-free threshold and raised old age pensions. I am using people around retirement age as the most likely affected group.
With an ageing population, many are concerned for their retirement. Younger voters will see many more changes to superannuation before they retire, and probably have more immediate concerns. This policy is complex, with gains and losses. There is less government contribution to superfunds and less tax concessions for the rich but a higher tax-free threshold and raised old age pensions. I am using people around retirement age as the most likely affected group.
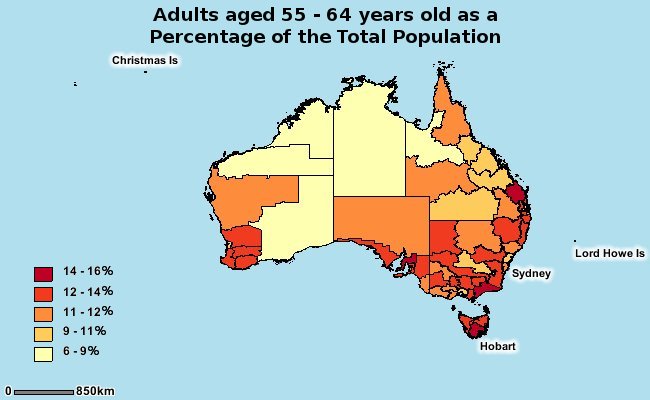
This data is a little old, so many of the people represented here will have already retired. However, this is still probably a good approximation of near-retiring population distributions.
Announcement 3: Funding Reduction for
Universities
One of the most publicised losers of this budget, the government is winding back promised funding for universities. To be precise, universities will not be losing money, but their funding will not increase by as much as it has been recently. The problem for universities are firstly that some have already decided how to spend the money they now won't be getting, and secondly that the increase in enrolments may mean less money per student. The further commercialisation of tertiary education will most likely result. This is not something I will get into here since I try to avoid expressing personal opinions, but it is an issue that many students understandably have strong feelings on.

Announcement 4: Funding Increase for Schools
Although not a 1 for 1 correlation, there has been a pairing of cuts to unis as "paying for" schools. In reality, of course, savings from the universities are added to the savings columns, expenses on schools added to the expenses columns and the totals are tallied. You could equally argue university wind backs are funding our military and it is the scrapped baby bonus that will fund education reforms.
Although not a 1 for 1 correlation, there has been a pairing of cuts to unis as "paying for" schools. In reality, of course, savings from the universities are added to the savings columns, expenses on schools added to the expenses columns and the totals are tallied. You could equally argue university wind backs are funding our military and it is the scrapped baby bonus that will fund education reforms.

However you wrap it up, it is obvious that there are far more children attending (compulsory) primary and secondary education (as well as childcare facilities and other institutions gaining a funding boost) than there are uni attendees. Arguing that the government is disadvantaging the few to benefit the many, along with the point that without a strong school system the universities will struggle anyhow, will no doubt be a common focus in the election campaign.
Announcement 5: Scrapping the Baby Bonus
Announcement 5: Scrapping the Baby Bonus
This is a hard one to model since the census does not specifically record the number of pregnant women or couples trying for a child. This is also the most likely category to be skewed by the age of this data, since couples with a baby in 2006 may or may not have another in 2013. It does however suggest that these areas are populated by demographics likely to have children (young couples with financial security to start a family, areas with high teen-pregnancy rates etc.) which may well still be the case today.
The best I could do was model the population of children under four years of age.

Further analysis of these maps to follow...
* Unfortunately the 2011 Census is still being processed for cartographic applications, so the map data dates from 2006 and may be inaccurate. Maps are based on place of usual residence.
No comments:
Post a Comment